mpandroidchartlibrary-2-1-6.jar

mpandroidchartlibrary-2-1-6.jar是一个安卓开源图标库mpandroidchartlibrary的jar包,缺少本报将无法正常使用安卓开源图标库,本包可以实现选择、缩放、拖放功能。文件预览
使用实例
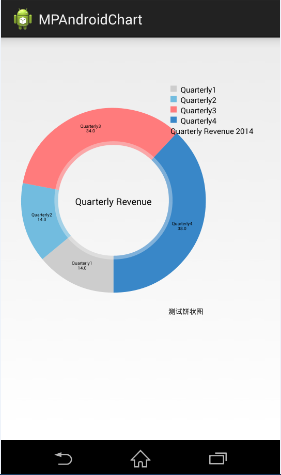
下面主要实现以下饼状图:
1.下载最新mpandroidchartlibrary.jar包, 然后copy到项目的libs中
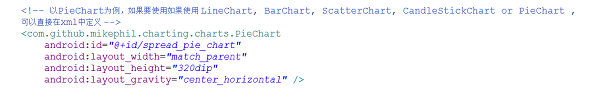
2.定义xml文件
3.主要java逻辑代码如下,注释已经都添加上了。
package com.jackie.mpandroidpiechart;
import java.util.arraylist;
import com.github.mikephil.charting.charts.piechart;
import com.github.mikephil.charting.components.legend;
import com.github.mikephil.charting.components.legend.legendposition;
import com.github.mikephil.charting.data.entry;
import com.github.mikephil.charting.data.piedata;
import com.github.mikephil.charting.data.piedataset;
import android.support.v7.app.actionbaractivity;
import android.graphics.color;
import android.os.bundle;
import android.util.displaymetrics;
public class mainactivity extends actionbaractivity {
private piechart mchart;
@override
protected void oncreate(bundle savedinstancestate) {
super.oncreate(savedinstancestate);
setcontentview(r.layout.activity_main);
mchart = (piechart) findviewbyid(r.id.spread_pie_chart);
piedata mpiedata = getpiedata(4, 100);
showchart(mchart, mpiedata);
}
private void showchart(piechart piechart, piedata piedata) {
piechart.setholecolortransparent(true);
piechart.setholeradius(60f); //半径
piechart.settransparentcircleradius(64f); // 半透明圈
//piechart.setholeradius(0) //实心圆
piechart.setdescription(测试饼状图);
// mchart.setdrawyvalues(true);
piechart.setdrawcentertext(true); //饼状图中间可以添加文字
piechart.setdrawholeenabled(true);
piechart.setrotationangle(90); // 初始旋转角度
// draws the corresponding description value into the slice
// mchart.setdrawxvalues(true);
// enable rotation of the chart by touch
piechart.setrotationenabled(true); // 可以手动旋转
// display percentage values
piechart.setusepercentvalues(true); //显示成百分比
// mchart.setunit( ?;
// mchart.setdrawunitsinchart(true);
// add a selection listener
// mchart.setonchartvalueselectedlistener(this);
// mchart.settouchenabled(false);
// mchart.setonanimationlistener(this);
piechart.setcentertext(quarterly revenue); //饼状图中间的文字
//设置数据
piechart.setdata(piedata);
// undo all highlights
// piechart.highlightvalues(null);
// piechart.invalidate();
legend mlegend = piechart.getlegend(); //设置比例图
mlegend.setposition(legendposition.right_of_chart); //最右边显示
// mlegend.setform(legendform.line); //设置比例图的形状,默认是方形
mlegend.setxentryspace(7f);
mlegend.setyentryspace(5f);
piechart.animatexy(1000, 1000); //设置动画
// mchart.spin(2000, 0, 360);
}
/**
*
* @param count 分成几部分
* @param range
*/
private piedata getpiedata(int count, float range) {
arraylist
for (int i = 0; i < count; i++) {
xvalues.add(quarterly + (i + 1)); //饼块上显示成quarterly1, quarterly2, quarterly3, quarterly4
}
arraylist
// 饼图数据
/**
* 将一个饼形图分成四部分, 四部分的数值比例为14:14:34:38
* 所以 14代表的百分比就是14%
*/
float quarterly1 = 14;
float quarterly2 = 14;
float quarterly3 = 34;
float quarterly4 = 38;
yvalues.add(new entry(quarterly1, 0));
yvalues.add(new entry(quarterly2, 1));
yvalues.add(new entry(quarterly3, 2));
yvalues.add(new entry(quarterly4, 3));
//y轴的集合
piedataset piedataset = new piedataset(yvalues, quarterly revenue 2014/*显示在比例图上*/);
piedataset.setslicespace(0f); //设置个饼状图之间的距离
arraylist
// 饼图颜色
colors.add(color.rgb(205, 205, 205));
colors.add(color.rgb(114, 188, 223));
colors.add(color.rgb(255, 123, 124));
colors.add(color.rgb(57, 135, 200));
piedataset.setcolors(colors);
displaymetrics metrics = getresources().getdisplaymetrics();
float px = 5 * (metrics.densitydpi / 160f);
piedataset.setselectionshift(px); // 选中态多出的长度
piedata piedata = new piedata(xvalues, piedataset);
return piedata;
}
}
效果图如下:
主要是一些基本属性和api的调用,具体每个api都有什么样的效果和作用,只能靠自己去尝试。后面还会陆陆续续为大家介绍mpandroidchart其他类型的图表。